I’ve seen Dev and Test environments that are well governed, compliant, secure… but everyone was jumping straight from Dev to Prod.
Why? They knew Test was so far behind Prod it no longer held any use. It was too hard to keep in sync.
When it is used, engineers spin their wheels on errors that don’t exist in production, eventually breaking their pipelines and notebooks anyway. Missing artifacts are one thing, but deeply nested parameter changes in jobs and Lakeflow Connect (LFC) pipelines kill productivity.
It becomes more than “tech debt” it becomes a credibility issue and it is restricting your team from delivering on time and on budget.
It is restricting your team from delivering on time and on budget. As data teams, we trade in trust and efficiency. When you break production and take down 1/4 of your data estate because a change was made based on out-of-sync environments, you instantly lose that trust.
The Hard Truth? Once you lose trust with your stakeholders, it is 10 times harder to get it back.
The $50k Mistake: “Zero Tables In Production”
I’ve seen this first hand. A consulting company comes in to help get a critical chunk of tables moved from bronze (raw) data into silver layer tables.
Three months later, there are still no new tables.
Half of the way through an engagement and nothing in production! Why? They were struggling to orchestrate the data because the pipelines that fed the bronze tables didn’t exist in the development or test environments.
Teams that don’t know how to easily keep the environments in sync, end up with their LFC pipelines and jobs that only live in production. This keeps everyone from efficiently and thoroughly testing in the lower environments.

The Fix: Databricks Asset Bundles (DABs)
If you are not using DABs to move your Databricks artifacts between jobs or even just to update / edit Lakeflow Connect pipelines then you are doing it the hard way!
Think of a DAB as a container for your entire data project. It holds your code, your job definitions, your permissions, and your cluster configurations in a single deployable unit.
The goal here is Anti-Fragility. We want a system that survives deployment, not one that requires a prayer before you hit “merge.”
The New Weapon: Ingestion Monitoring DABs (Why You Need Visibility)
Automating deployment is step one. But once it’s running, how do you know it’s healthy?
Here is the dirty secret about standard Lakeflow Connect monitoring: The default UI is lying to you by omission.
While the Pipeline UI is user-friendly, it is “single-pipeline-run-centric.” You can see if one thing failed, but you cannot see the global health of your platform.
Until recently, accessing the SDP event log was a nightmare. It was historically difficult to use, and worst of all, trying to query these logs across many pipelines using the standard documentation examples was batch-oriented and costly to scale.
This is where the new “Ingestion Monitoring DABs” come in.
My Databricks rep just flagged this release, and it solves a massive headache for those of us managing enterprise-scale platforms. These new bundles (now public in the bundle-examples repo) are a quick-start solution that finally fixes the observability gap:
Scale Without Bankruptcy: They incrementally aggregate SDP event logs across many pipelines, replacing those expensive batch queries that spike your bill.
Single Pane of Glass: Instead of clicking through 50 different pipeline UIs, you get opinionated transformations into curated monitoring tables and sample AI/BI dashboards.
Integrate or Die: If you are a serious shop, you aren’t just looking at Databricks. You need your alerts in Datadog, Splunk, or New Relic. These DABs integrate with those third-party tools out of the box.
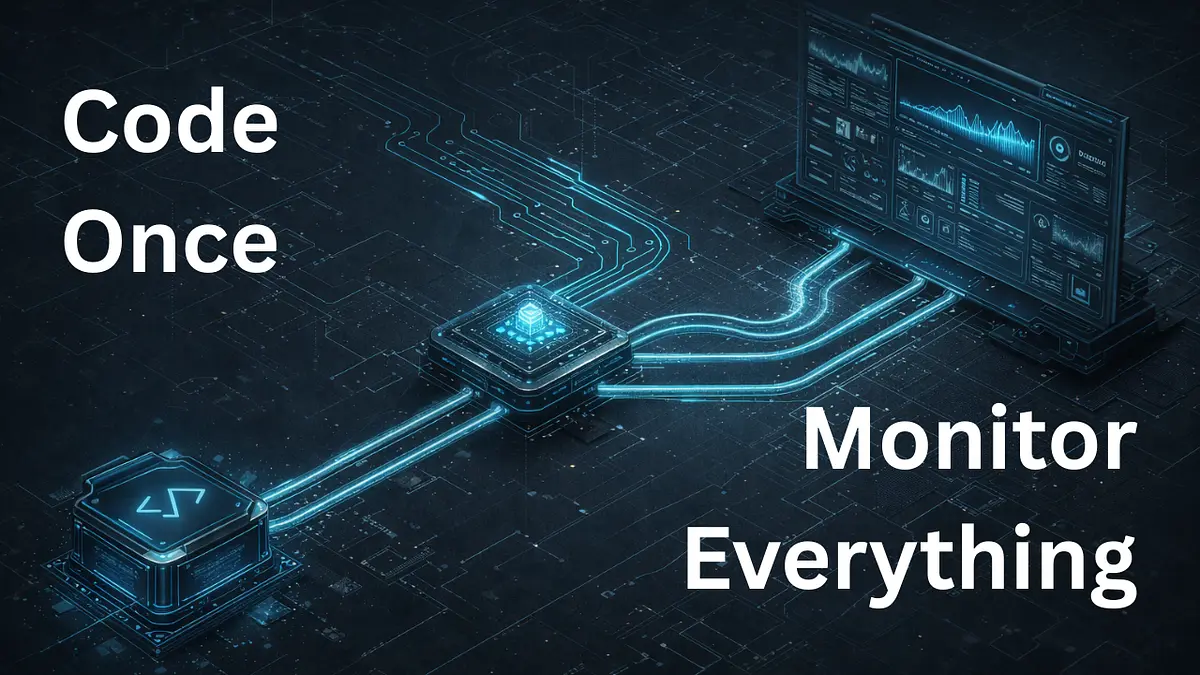
The Strategy: Code Once, Monitor Everything
The workflow for a Senior Engineer is now clear:
Define the Pipeline Once: Use DABs to define logic (YAML) a single time.
Variable Substitution: Configure environment variables so Dev points to
dev_schemaand Prod points toprod_schema.Deploy Monitoring: Use the new Ingestion Monitoring DABs to set up a “single pane of glass” with as few as 3 configuration options.
The Reality
If you aren’t thinking about how to bulk-add tables to your pipelines or automate your environment syncs, you are still thinking like a Junior Engineer.
Seniors look at logic gaps. Directors look at liability.
Manual deployments and siloed monitoring are liabilities. Automate your infrastructure and centralize your logs so you can focus on the logic that actually drives revenue.
Watch the full technical walkthrough on YouTube here to see exactly how I configure the YAML files and environment variables to prevent drift.
Then, head to the bundle-examples repo and pull down the monitoring config.
About the Author
To the 100+ new subscribers who joined this week: You are not here for a coding tutorial. You are here for a survival guide.
I am a Senior Data Strategy and Engineering Leader with over 25 years of experience building systems that handle billions of dollars and petabytes of data. I have survived outages, divestitures, budget cuts, and platform migrations.
I am here to share the brutal truth, Data Platform PTSD, and lessons that bootcamps won’t show you.
Gambill Data operates on three core pillars:
Code to Cash: If your code doesn’t solve a business problem or save money, it doesn’t have a reason for existence.
Anti-Fragility: The goal is not to avoid errors; it is to build systems, generate revenue, and excel in careers that survive them.
Strategy > Syntax: Anyone can write code. Few can architect for production.
If you are ready to stop thinking like a Junior Engineer and start thinking like a Strategic Partner, you are in the right place.
Join me in the trenches:
YouTube: The Data Engineering Channel – Weekly video breakdowns of production horrors and architectural reviews.
LinkedIn: (Chris Gambill & Gambill Data) Insights on navigating the data job market without the fluff.